Featured Articles
Explore by region
Southern California
-
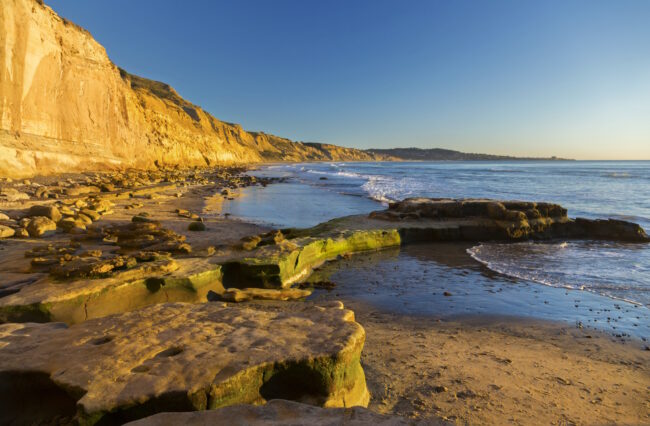
San Diego County
The San Diego County coastline starts at the border with Mexico and runs north to Orange County. In between are over 100 named beaches with a lot of diversity.
-
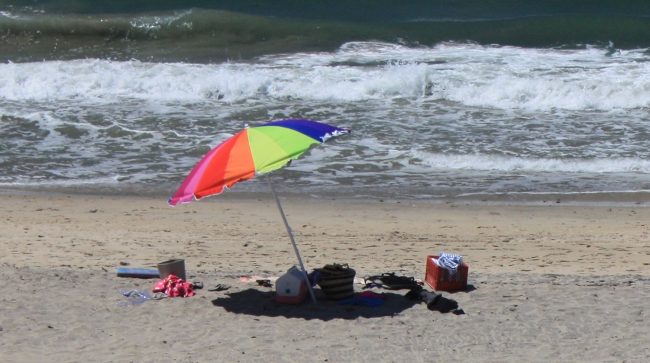
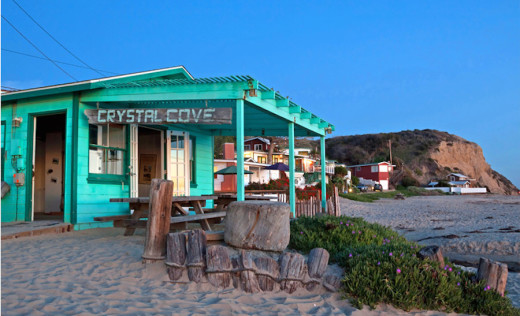
Orange County
Orange County is sandwiched between the large urban metropolises of San Diego and LA. The OC coastal cities are smaller in size, but they compete in the quantity and quality of their beaches.
-
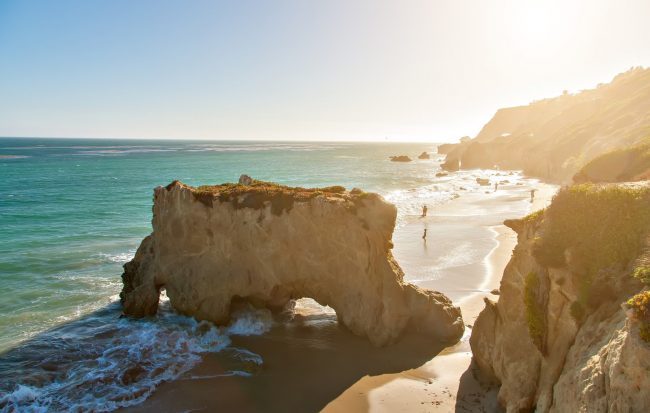
Los Angeles County
Los Angeles County is home to about ten million people and on sunny days it seems like most are at the beach. Luckily there are many amazing beaches from Long Beach to Malibu to choose from.
-
Catalina Island
Catalina Island is a short ferry ride away from ports in Long Beach, Dana Point, and Los Angeles. Catalina's public beaches are yours to discover.
Central California
-
Ventura County
Ventura County marks the southern end of the Central California Coast. Between ritzy Malibu and Montecito you'll find many uncrowded stunning beaches.
-
Santa Barbara County
Santa Barbara County has a long south-facing stretch of the Central California coastline with a Mediterranean feel. It’s no wonder that Santa Barbara is known as The American Riviera.
-
San Luis Obispo County
San Luis Obispo County is located along the Central California coast about mid-way between LA and the Bay Area. The SLO coastline is a long one with small cities spaced out just right.
-
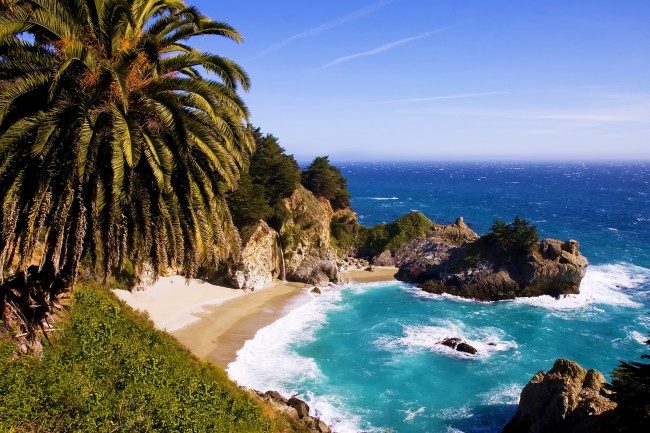
Monterey County
Monterey County has a diverse coastline that includes rugged beaches in the remote region of Big Sur and sandy beaches near the urban areas of Carmel and Monterey.
-
Santa Cruz County
The Santa Cruz County coastline is south of San Mateo County on the San Francisco Peninsula and just a short drive from San Jose and the southern San Francisco Bay Area.
Northern California
-
San Mateo County
San Mateo County takes up most of the San Francisco Peninsula south of San Francisco. San Mateo is known for its great beaches along the Pacific Coast from Pescadero to Half Moon Bay to Daly City.
-
San Francisco County
San Francisco County and San Francisco City are just different names for the same place. They both have the same boundaries and the same beaches.
-
Marin County
Marin County is just across the Golden Gate Bridge north of San Francisco. Marin has beaches on San Francisco Bay, Tomales Bay, and on Point Reyes National Seashore.
-
Sonoma County
The Sonoma County coast has a lot of great beaches but few cities. Drive Highway 1 from Bodega Bay to Jenner to Sea Ranch and you'll pass by many stunning coves and beaches.
-
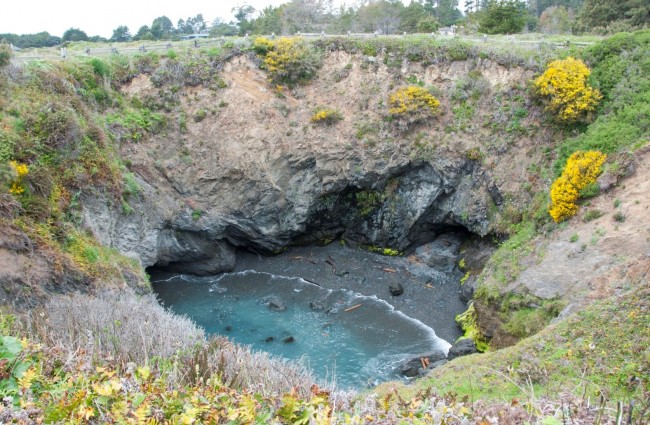
Mendocino County
Mendocino County has a large chunk of Northern California coastal real estate. Driving twisty Highway 1 through this county provides over 100 miles of scenic driving pleasure.
-
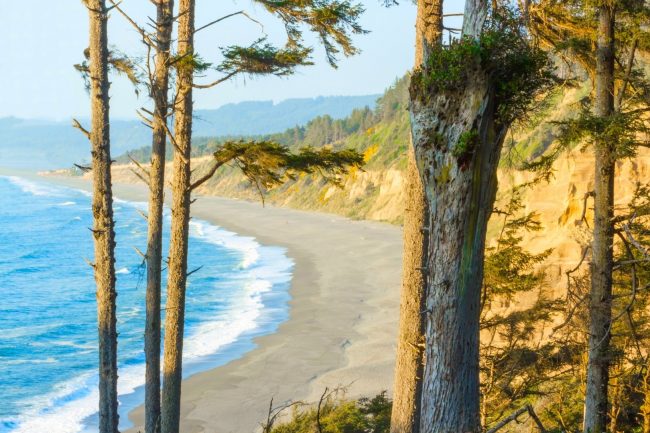
Humboldt County
The Humboldt County coast is chock full of wild and remote beaches that beg for exploration. Small towns like Trinidad, Ferndale and Shelter Cove are worthy destinations.
-
Del Norte County
Del Norte County is the northernmost coastal county in California and has more wild remote beaches than urban beaches.
Welcome to CaliforniaBeaches.com
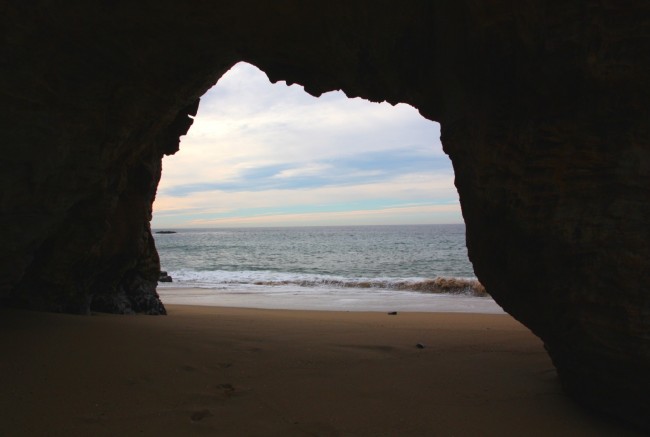
We created this website to be the definitive guide for California’s beaches. Not just the best beaches in California, but EVERY beach in California, including the most popular beaches and hidden gems that are seldom visited. You’ll also discover unique beaches and those with natural rock arches, historic fishing piers, vivid tidepools, and picturesque lighthouses. The diversity and features, both natural and man-made, are what make California’s beaches stand out amongst the world’s best.
In addition to our beach coverage, we also provide informative articles to help you find your next beach based on your favorite beach activities, beach camping and glamping, and highlight-worthy attractions. Our goal is to keep you connected to your favorite California beach destinations and to inspire you to visit places you never knew existed.